K-Means clustering
K-Means clustering#
K-Means is a data partitioning method and a combinatorial optimization problem.
Most unsupervised learning-based applications utilize the sub-field called Clustering. Clustering is the process of grouping data samples together into clusters based on a certain feature that they share. K-Means is a clustering algorithm.
They are used in machine learning. The idea behind k-Means is that, we want to add k new points to the data we have. Each one of those points — called a Centroid — will be going around trying to center itself in the middle of one of the k clusters we have. Once those points stop moving, our clustering algorithm stops.
Input : data points Process : groups this data points into k clusters. This process is the training phase of the learning algorithm. Result : a model that takes a data sample as input and returns the cluster that the new data point belongs to, according the training that the model went through
from copy import deepcopy
import numpy as np
import pandas as pd
from matplotlib import pyplot as plt
plt.rcParams['figure.figsize'] = (16, 9)
plt.style.use('ggplot')
# Importing the dataset
data = pd.read_csv('test.csv')
print("Input Data and Shape")
print(data.shape)
data.head()
# Getting the values and plotting it
f1 = data['V1'].values
f2 = data['V2'].values
X = np.array(list(zip(f1, f2)))
plt.scatter(f1, f2, c='black', s=7)
# Euclidean Distance Caculator
def dist(a, b, ax=1):
return np.linalg.norm(a - b, axis=ax)
# Number of clusters
k = 3
# X coordinates of random centroids
C_x = np.random.randint(0, np.max(X)-20, size=k)
# Y coordinates of random centroids
C_y = np.random.randint(0, np.max(X)-20, size=k)
C = np.array(list(zip(C_x, C_y)), dtype=np.float32)
print("Initial Centroids")
print(C)
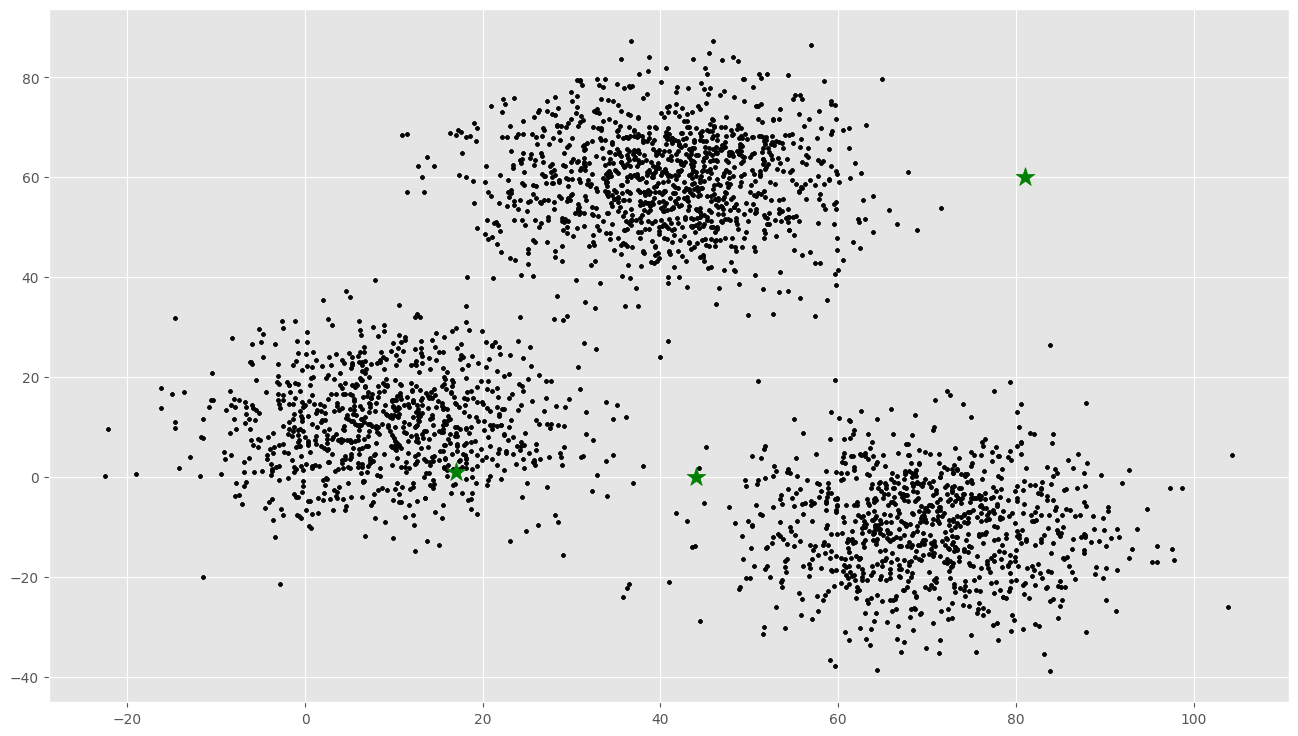
# Plotting along with the Centroids
plt.scatter(f1, f2, c='#050505', s=7)
plt.scatter(C_x, C_y, marker='*', s=200, c='g')
# To store the value of centroids when it updates
C_old = np.zeros(C.shape)
# Cluster Lables(0, 1, 2)
clusters = np.zeros(len(X))
# Error func. - Distance between new centroids and old centroids
error = dist(C, C_old, None)
# Loop will run till the error becomes zero
while error != 0:
# Assigning each value to its closest cluster
for i in range(len(X)):
distances = dist(X[i], C)
cluster = np.argmin(distances)
clusters[i] = cluster
# Storing the old centroid values
C_old = deepcopy(C)
# Finding the new centroids by taking the average value
for i in range(k):
points = [X[j] for j in range(len(X)) if clusters[j] == i]
C[i] = np.mean(points, axis=0)
error = dist(C, C_old, None)
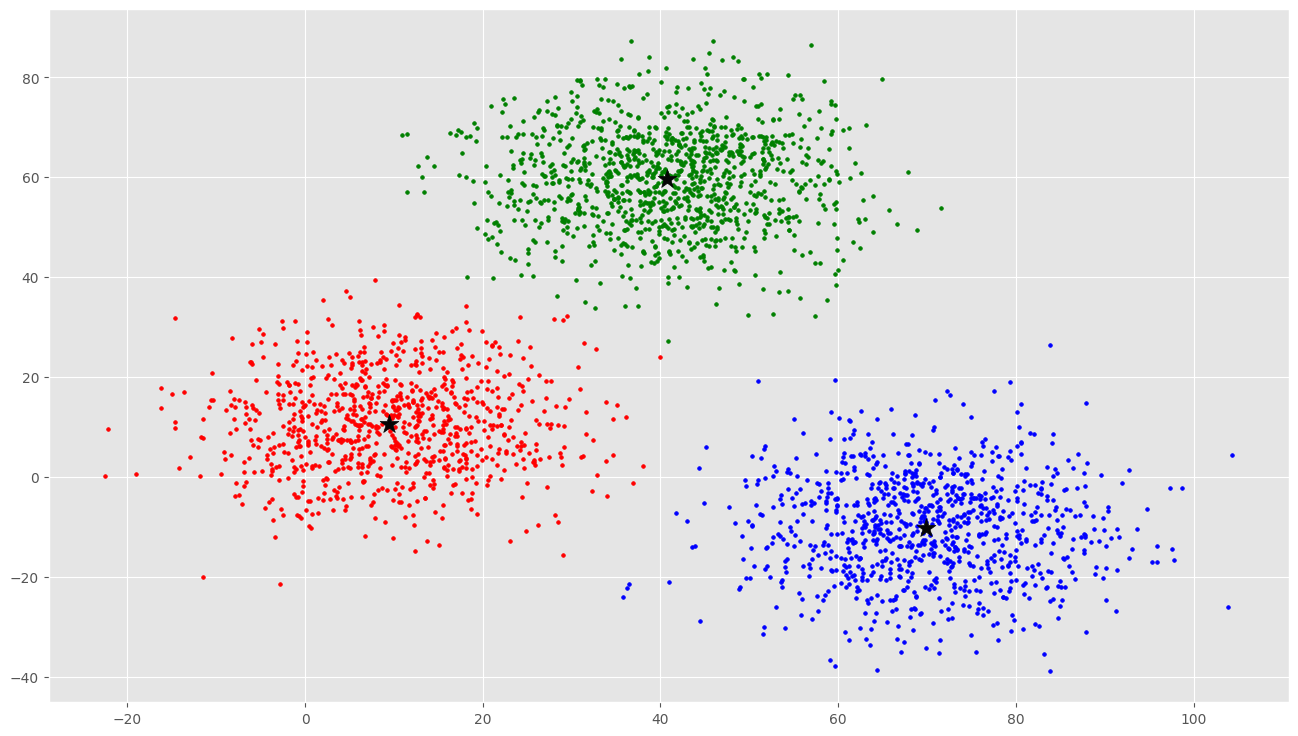
colors = ['r', 'g', 'b', 'y', 'c', 'm']
fig, ax = plt.subplots()
for i in range(k):
points = np.array([X[j] for j in range(len(X)) if clusters[j] == i])
ax.scatter(points[:, 0], points[:, 1], s=7, c=colors[i])
ax.scatter(C[:, 0], C[:, 1], marker='*', s=200, c='#050505')
Input Data and Shape
(3000, 2)
Initial Centroids
[[17.  1.]
 [81. 60.]
 [44.  0.]]
<matplotlib.collections.PathCollection at 0x7fce611c6490>
import numpy as np
import matplotlib.pyplot as plt
from mpl_toolkits.mplot3d import Axes3D
from sklearn.cluster import KMeans
from sklearn.datasets import make_blobs

plt.rcParams['figure.figsize'] = (16, 9)

# Creating a sample dataset with 4 clusters
X, y = make_blobs(n_samples=800, n_features=3, centers=4)
fig = plt.figure()
ax = Axes3D(fig)
ax.scatter(X[:, 0], X[:, 1], X[:, 2])

# Initializing KMeans
kmeans = KMeans(n_clusters=4)
# Fitting with inputs
kmeans = kmeans.fit(X)
# Predicting the clusters
labels = kmeans.predict(X)
# Getting the cluster centers
C = kmeans.cluster_centers_

fig = plt.figure()
ax = Axes3D(fig)
ax.scatter(X[:, 0], X[:, 1], X[:, 2], c=y)
ax.scatter(C[:, 0], C[:, 1], C[:, 2], marker='*', c='#050505', s=1000)
---------------------------------------------------------------------------
ModuleNotFoundError                       Traceback (most recent call last)
/tmp/ipykernel_1754/2214068827.py in <module>
      2 import matplotlib.pyplot as plt
      3 from mpl_toolkits.mplot3d import Axes3D
----> 4 from sklearn.cluster import KMeans
      5 from sklearn.datasets import make_blobs
      6

ModuleNotFoundError: No module named 'sklearn'